History of big data
The first known use of the term big data was recorded in the 1980s. The term wasn’t coined until 2005, when Roger Mougalas, of O’Reilly Media, used it to describe when the amount of data generated became too much for existing tools to process.
The application of big data and the quest to understand the available data is something that has been in existence for a long time. Some of the earliest records of the application of data to analyze and control business activities date as far back as 7,000 years with the introduction of accounting in Mesopotamia to record crop growth and herding.
In 1663, London-born John Graunt recorded and analyzed information on the rate of mortality in London from the bubonic plague. He is regarded as the founder of demography and was possibly the first epidemiologist.
After Graunt’s work accounting principles continued to improve and develop. It wasn’t until the 20th century when the information era began.
American businessman, inventor and statistician Herman Hollerith, invented an electromechanical tabulating machine for punched cards in 1889 in an attempt to organize census data.
The next noteworthy data development happened in 1937 under the Franklin Roosevelt administration. When the Social Security Act was passed by congress, the government was required to keep track of millions of Americans. The government contracted IBM to develop a punch-card ready system that would be applied in this extensive data project.
The first data-processing machine was developed by the British in 1943 to decipher Nazi codes in World War II. The machine, named Colossus, worked by searching for any patterns that would appear regularly in the intercepted messages. Colossus worked at a record rate of 5,000 characters per second, which reduced work that previously took weeks to just a few hours.
From the development of Colossus, the National Security Agency was created in the United States in 1952. Employees were tasked with decrypting the obtained messages during the course of the Cold War. Machine development at this stage had advanced to a level where machines could independently and automatically collect and process information.
The first data center was built by the U.S. government in 1965 for the purpose of storing millions of tax returns and fingerprint sets. This was achieved by transferring every record onto magnetic tapes that were to be stored systematically in a central location. While this initiative didn’t continue due to fear of sabotage or acquisition, it’s widely accepted that this was the starting point of electronic big storage.
Tim Berners-Lee, a British computer scientist, invented the World Wide Web in 1989, which enabled the sharing of information through a hypertext system.
In the 1990s the creation of data grew at an extremely high rate as more devices gained capacity to access the internet.
The first super computer was built in 1995. The computer had the capacity to handle work that would take a single person thousands of years to complete, in a matter of seconds.
Source: Cleverism.com
The three “Vs” of big data: Volume, velocity and variety.
Volume: as recently as 20 years ago, typical computers had about 10 gigabytes of memory. Now, social media platforms including Facebook, Twitter, Instagram and Tik Tok take in more than half a billion terabytes of data on a daily basis.
Smartphones and tablets result in the generation of billions of terabytes of constantly updated data feeds of infinitely diverse genres. Today’s airplanes generate hundreds of terabytes in flight data in a single flight.
Velocity: Clickstream data, a trail of digital behaviors left by users as they click through a website contains valuable consumer information for businesses. As an example, stock trading market changes are revealed in microseconds as computer processes exchange data between billions of gadgets, infrastructure and sensors to generate accurate and applicable data in real time.
Online gaming systems are one example that supports millions of users operating concurrently with each user producing multiple inputs by the second.
Variety: Dates and numbers are not the only things involved in big data. Audio, video, unstructured text, social media information and many more uses.
Just two decades ago, database systems were designed to address a smaller volume of structured data along with slower and fewer updates. These systems were designed to operate on single servers, making an increase in capacity very expensive.
Programs and applications have evolved to serve huge volumes of users. The use of outdated databases has become a liability as opposed to an asset for businesses. Big data solves the issues of outdated databases and provides great value to businesses.
Source: Cleverism.com
The term “big data” has several meanings and applications. It includes artificial intelligence, data analytics and data management.
Businesses use big data to analyze and understand their customers’ behaviors and interests. Use of social media, sensor data and browser logs helps businesses know what their customers want or need.
With this knowledge, the business can create prediction models to be able to provide products or services to consumers more efficiently.
Teaching big data
Dale Lehman, director at the Center for Business Analytics and professor of business administration at Loras College, said there’s no consistent definition for the term “big data.”
“Some people refer to data that has a large volume or many data points, a variety of different types of data and data that is generated at a high velocity.”
“One practical definition speaks of data that cannot by analyzed on a stand-alone desktop computer. Some data has always been ‘big.’ Some is always ‘bigger’ than other data. ‘Big data’ is really a marketing term without any concrete meaning.”
Loras College has undergraduate degrees in business analytics and data science, as well as a minor in business analytics.
The college also offers a graduate program, a Masters in applied analytics.
“The courses in these programs cover topics including data visualization, databases, programming, data science, predictive modeling, marketing analytics, machine intelligence and the ethical use of analytics,” Lehman said. “We also have a number of courses devoted to practical application of data analysis for local organizations.”
Lehman explained that the biggest technological advance in big data is in machine intelligence, often called artificial intelligence, AI or automated machine learning.
“Applications of these technologies involved having computers ‘learn’ patterns in data including text and images and making decisions based on these patterns.”
“Every time you do a Google search, these patterns or algorithms are guessing at your meaning and intentions (they don’t always get it right). A GPS system in your car is doing this, and self-driving cars are perhaps the ultimate application of these technologies.”
These applications also lie behind more mundane things, such as processing mortgage applications, flagging suspicious credit card activity or helping baseball managers decide whether or not to intentionally walk a batter.
“Algorithmic decision making is perhaps the most active area of current development. Understanding its potential, as well as its limitations will be critical for the future,” Lehman said.
“We know that much of the success of big business has been built on the use of data — think of Walmart, Amazon, Google, for examples. But virtually all organizations of any size have data and can utilize it for making better decisions,” Lehman said.
Nonprofit organizations want to measure and improve their effectiveness and granting agencies increasingly require documentation of this data. Small locally based businesses have data on their customers and operations but often don’t have the expertise to understand how to use this data productively.
All health care, financial and educational organizations are required to collect and report massive amounts of data, but are only beginning to see the uses of this data for improving their decisions.
“I would suggest that much of the value that lies in data has not yet been realized,” Lehman said.
Business use of big data
Businesses are increasing the use of big data analytics to make evidence-based decisions rather than using their “gut feelings” as they would have done traditionally,” Afzal Upal said.
Upal, the professor and chair of the computer science and software engineering department at the University of Wisconsin-Platteville, said the university offers a major and minor in data science. Students majoring in computer science and software engineering can take elective courses that will teach them techniques for dealing with large volumes of data. The courses include artificial intelligence, machine learning and big data analytics.
“By using big data, businesses can improve their internal business processes to produce better products for their customers more efficiently and for a lower price,” Upal said.
Businesses also are using big data to improve the understanding of their customers’ needs and desires. A better understanding of what types of products their customers are likely to buy in the future allows them to focus their future production and marketing efforts on the market segment where they’re most likely to have the largest impact.
Upal added that the big data revolution has been made possible by three fundamental developments.
• The availability of large amounts of data made possible by advancements in computer hardware as predicted by Moore’s Law.
In 1965, Gordon E. Moore, the co-founder of Intel, hypothesized that the number of transistors that can be packed into a given unit of space would double about every two years. Today, the doubling of installed transistors on silicon chips occurs at a much faster pace than that.
• Advances in cloud computing allows massive amounts of data to be stored and processed.
• Advances in machine learning technologies allowing vast amounts of data to be analyzed, particularly deep learning and learning from natural language.
Deep learning is a class of machine learning algorithms that uses multiple layers to progressively extract higher-level features from raw input.
Natural language technologies allow a machine to quickly sift through the ever-growing volumes of data to identify key ideas and topics.
Working with big data
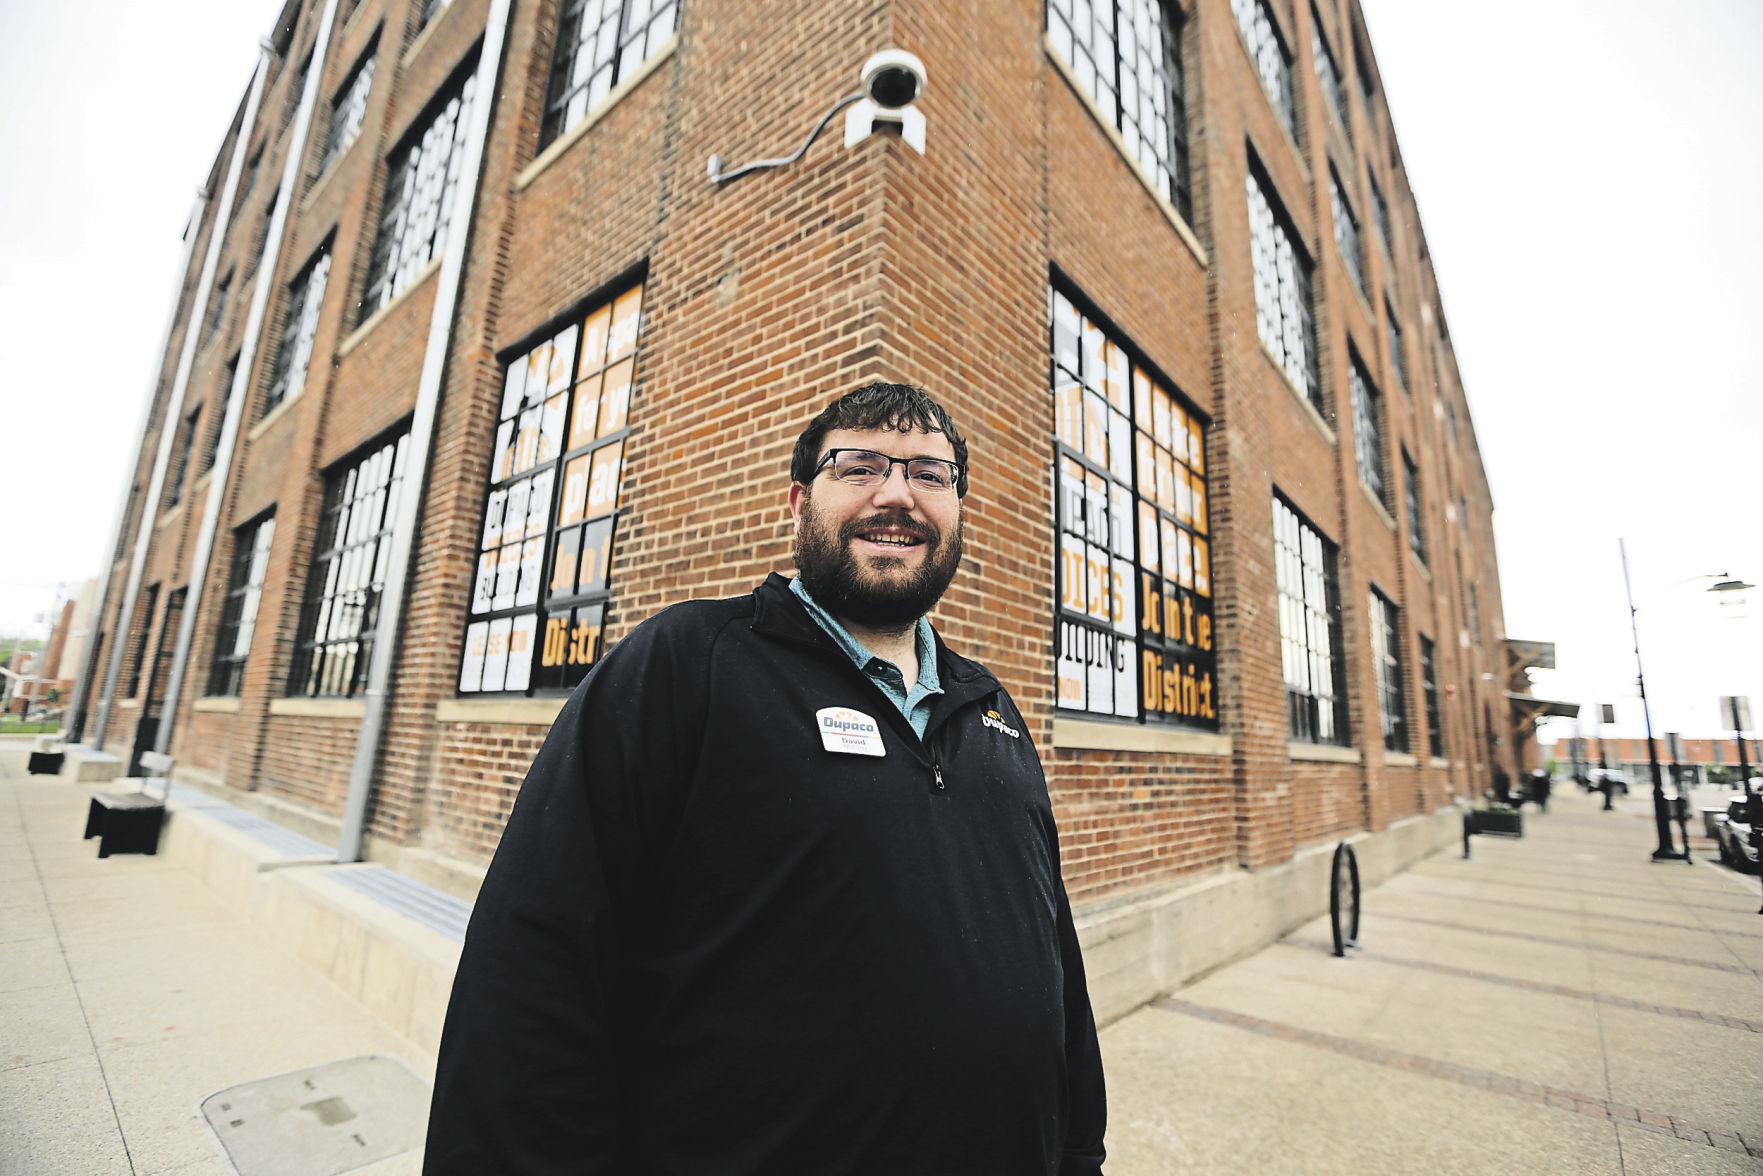
“I did not ever think that I would end up working with data. To me when I was growing up, computer science was fixing a computer for someone,” David McElroy said.
McElroy, a Loras College grad, earned an MBA with an emphasis in data analytics and has worked at Dupaco Community Credit Union for five years as the data architecture supervisor.
It was during his freshman year at Loras that McElroy took an algebra class with professor Steve Mosiman.
“We used a program on our laptops called Derive. I did some things in Derive that Mosiman didn’t know about. He talked with me about computer science classes. I took the course he asked me to consider, and the rest is history,” McElroy said.
While in high school at East Buchanan High School in Winthrop, Iowa, classes in programing or data were not offered. McElroy has donated money and devices to his former high school to help build out science, technology, engineering and math related courses.
At Dupaco, McElroy’s typical day starts off checking to see if any of the hundreds of daily jobs scheduled have failed. Then the team works on building new jobs as part of the sprint or experiment they are working on.
His group has three members and he also works with the financial data, marketing analytics and accounting teams, which have an additional 12 members.
Data that the Dupaco team works on is related to the credit union members.
“We work with general member data as well as transactional data. We use this data to do what we can do to maximize what members can get back from the cooperative and to determine what categories make the most sense for our members,” McElroy said.
An example of how McElroy and his team uses member data is the Thank Use program, a participation dividends program where members earn rewards for using their debit card, building their savings account, using the financial and insurance services. The program promotes financial well-being through education, better rates and fewer fees.
Adding big data to the curriculum
Northeast Iowa Community College recently was approved by the Iowa Department of Education to offer a certificate in data analytics.
“The nine credit certificate will include introductory, intermediate and advanced classes in data analytics,” said Michael Gau, associate dean of liberal arts, sciences and business at NICC.
“The certificate will provide data analysis education to students of all current disciplines and provides stand-alone education for those in the workforce who may want to supplement their employment skills with data analysis education.”
In addition, the Business and Community Solutions department has a data analytics course for anyone interested in noncredit education in the area of data analysis. The BCS course will be offered in the fall 2021.
Customized training for any business that might want or need to upskill their employees on data analytics is offered through the BCS.
While there are many software packages and services produced to make data analysis as user-friendly as possible, having trained data analysts in-house is more economical and efficient than outsourcing data projects.
“The technology is there – it’s simple enough to write a code to simulate a sales projection, however, not many employees have these skills and the price for these services can be high,” said Jeremy Durelle, science instructor at NICC.
“The push from businesses regarding big data is that it is far less expensive to hire data analysts in-house, rather than paying anywhere from 20K to 80K for an outside data analyst company,” Durelle added.


